A Python GUI app for generating epitrochoids and hypotrochoid parametric equations. This is what the Spirographs toy does using gears.
- Python 100%
| img | ||
| .gitignore | ||
| LICENSE | ||
| README.md | ||
| spirographs.glade | ||
| spirographs.py | ||
Spirographs!
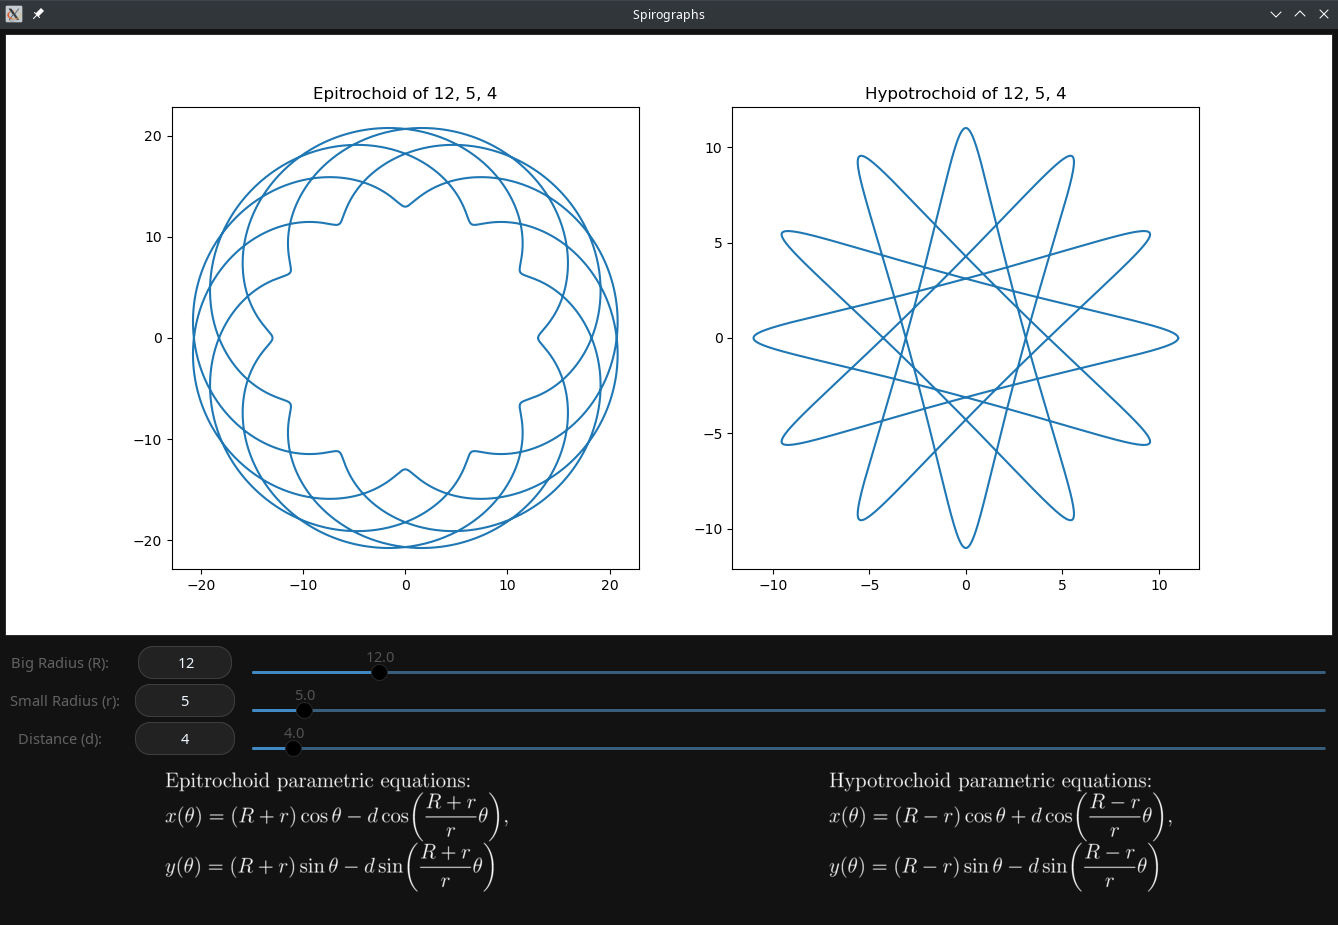
Everyone who grew up playing with this toy remembers it fondly. Very cool shapes and patterns. Recently, I was wondering if there was a mathematical formula describing the shapes created by Spriographs, and of course there is!
They're actually quite simple. The shapes are called hypotrochoids and epitrochoids. To calculate each point, you simple use the following parametrized equations, plugging in 0 to 2π for θ:
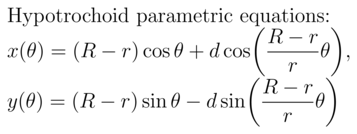
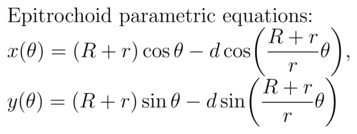
And that's it! To play around with the different patterns, this Python GTK3 app was created so you could use sliders to change the parameters and see how they affect the output.